Report Sections Overview
The Investment Monitoring Report offers a variety of report section options that can be included when generating a report. The report section options that are available to you include standard report sections, as well as Advanced Analytics report sections provided by MPI (Markov Processes International).
Report sections names that are proceeded by "Advanced Analytics" are report sections that are available from the integration with MPI. The Advanced Analytics report sections provide expanded details on various investment measures and analyses.
Report sections names that include "Current vs Proposed" in the report section title will separate P - Proposed status funds from the rest of the fund lineup in the report section. These report section versions can be useful for comparing a proposed fund lineup vs. an incumbent lineup, or for simply separating existing investments from proposed alternatives.
Important: Advanced Analytics report sections will increase the amount of time that will be required for a report to generate. This is due to the additional processing time needed to gather and deliver report content from MPI. Please see the Report Generation article for more information on the report generation process.
Report Section Descriptions
Click the links below to jump to a description and screenshot of the report section.
Asset Allocation
Download Sample Asset Allocation Report Section
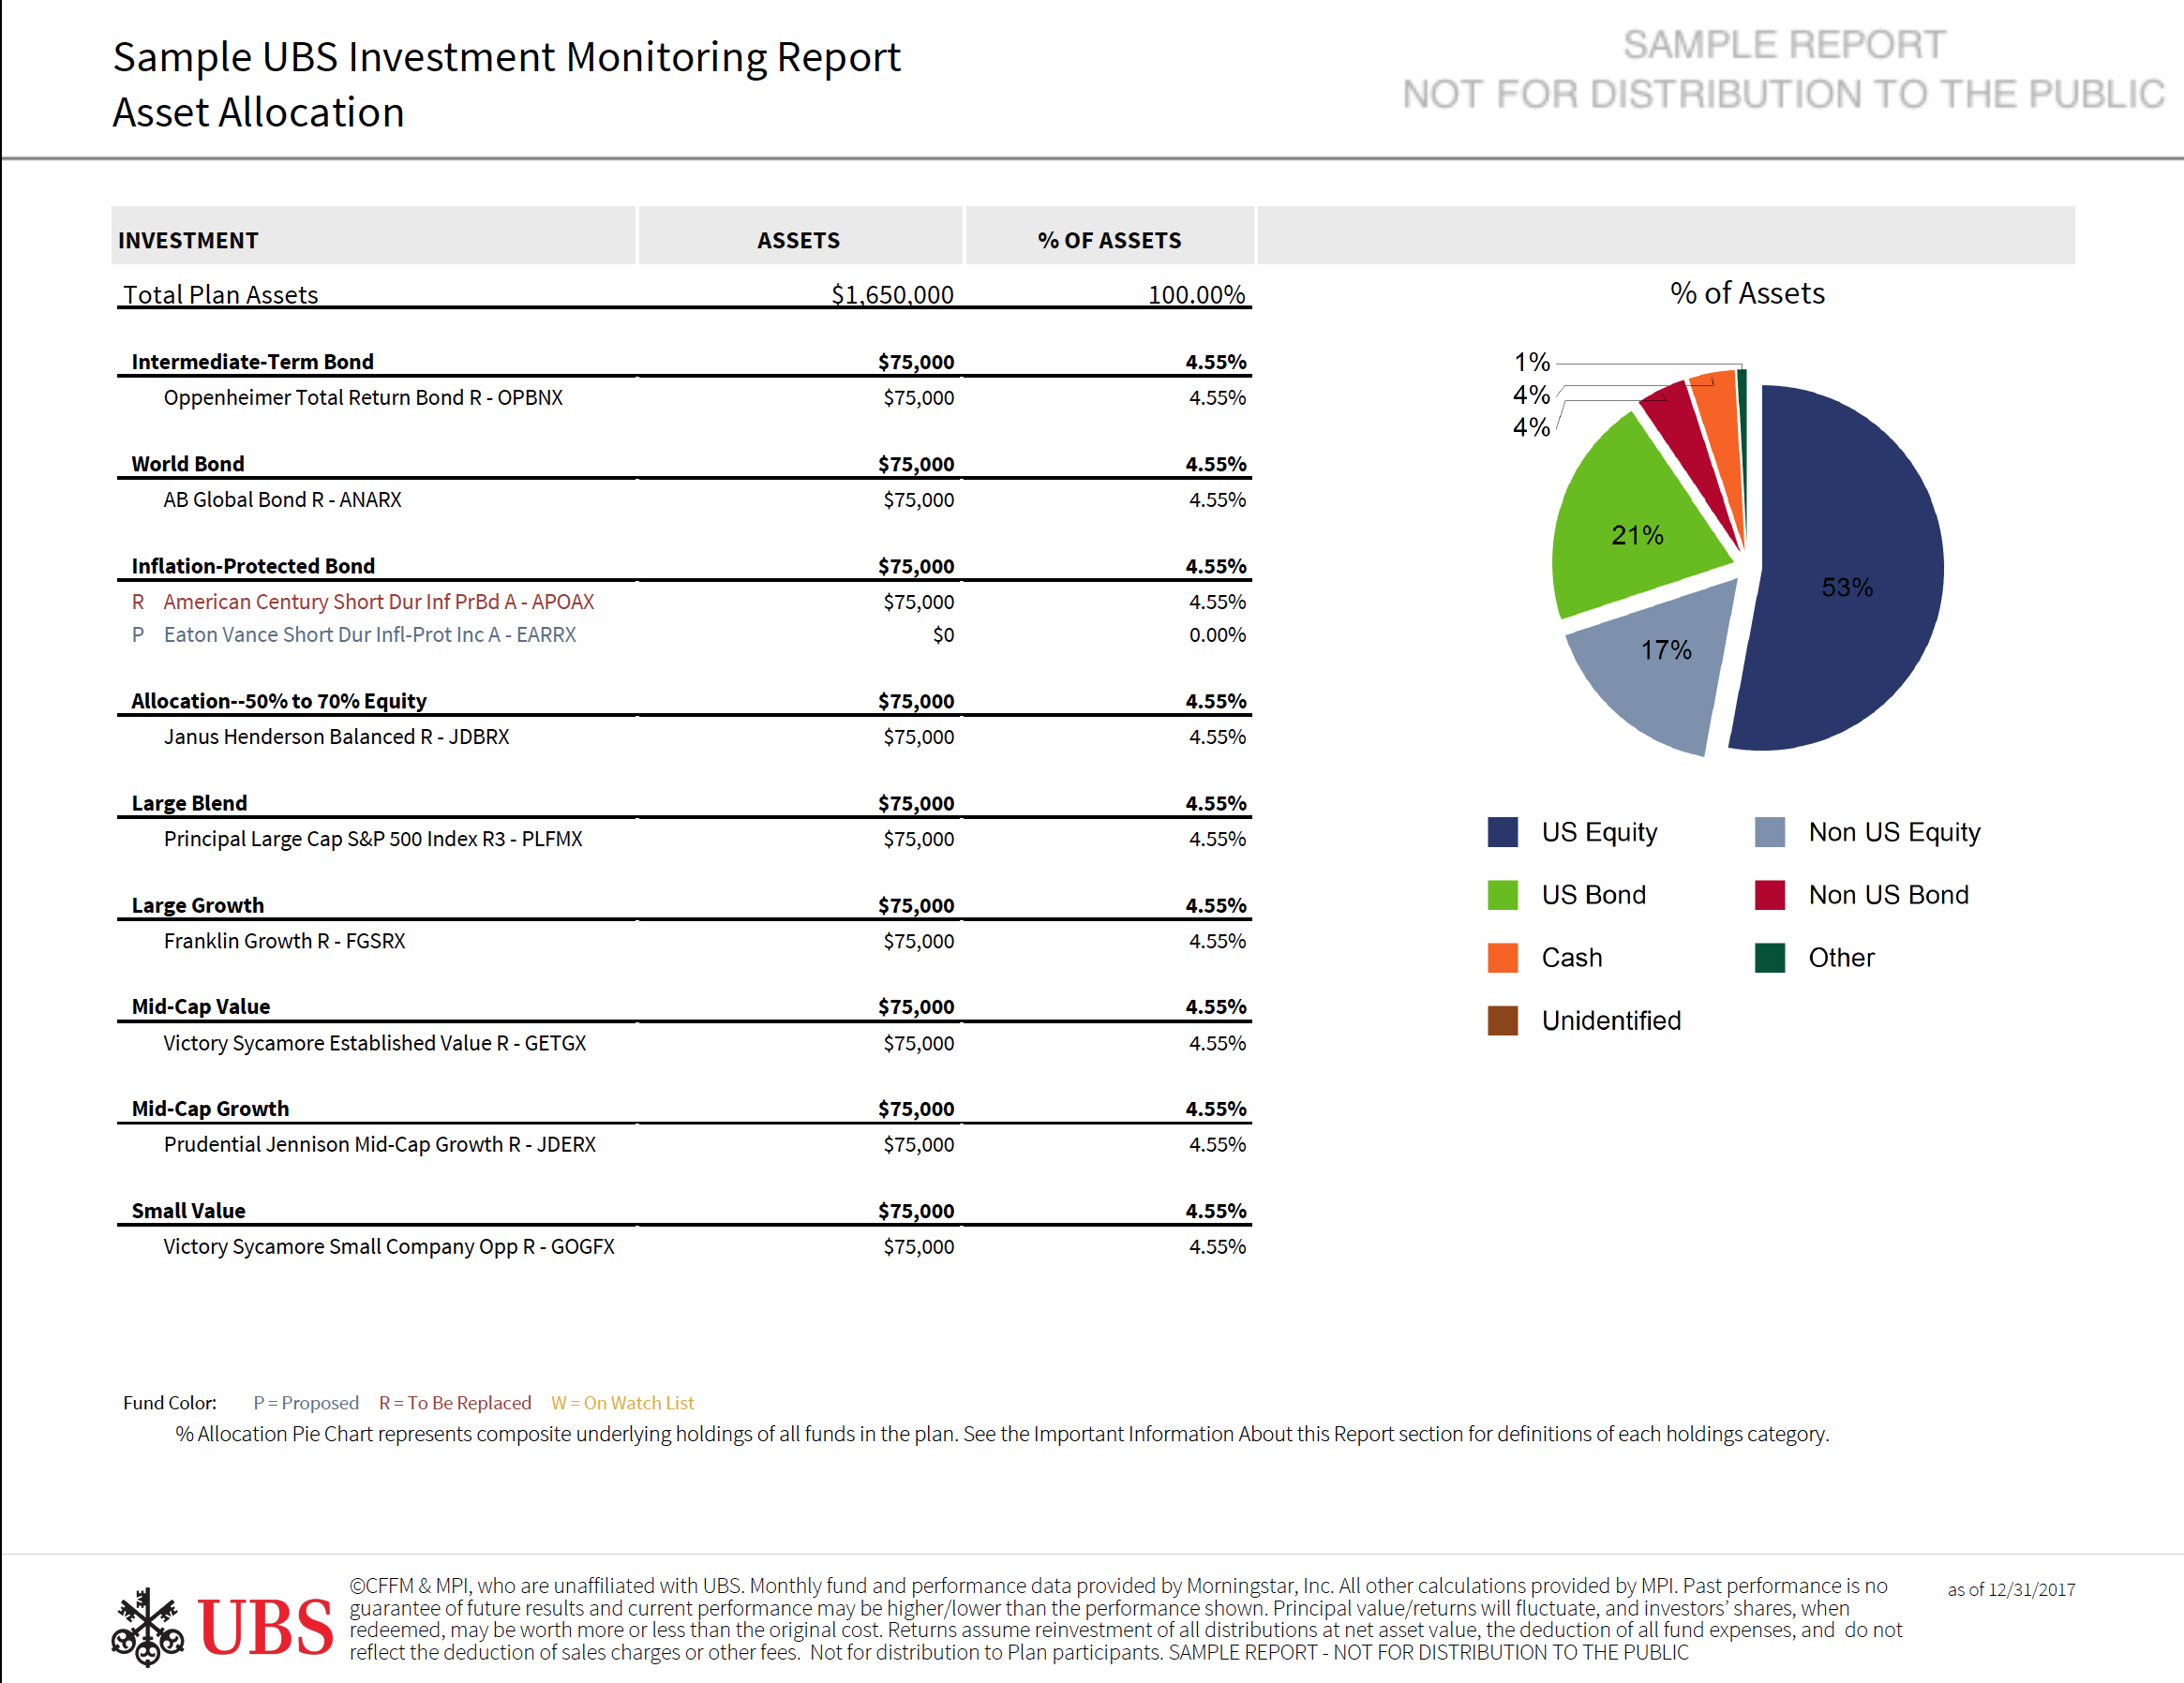
The Asset Allocation report section contains a break down of Plan assets by fund. Additionally, a lineup composition analysis is provided to the right of the first page. The composition graphic represents the composite underlying holdings of all funds in the Plan, weighted by fund assets.
Definitions and Disclosures
Download Sample Definitions and Disclosures Report Section
The Definitions and Disclosures report section contains a glossary of definitions for various terms used through the report. This report section also contains additional information on the asset category benchmarks and peer groups used throughout the report.
Executive Summary
Download Sample Executive Summary Report Section
The Executive Summary report section provides 3 separate pieces of content.
- The first is the selected Evaluation Criteria that are the basis for scoring investments throughout the report.
- The second is the Executive Summary Overview which provides the current and previous quarter scores for investments, current fund status actions, the number of quarters on watch, and a break down of which evaluation criteria passed / failed.
- The last is Fund Commentary that has been entered for any investment in the fund lineup. Fund comments are sorted in order of fund status (Watch, Proposed, To Be Replaced, Existing).
Executive Summary - Evaluation Criteria

Executive Summary - Overview

Executive Summary - Fund Commentary

Fund Criteria
Download Sample Fund Criteria Report Section
The Fund Criteria report section provides fund score details, fund by fund. Based on the chosen Evaluation Criteria for the Plan, the Fund Criteria report section will provide an overview of if the fund passed or failed a criteria, and the fund's calculated measure for the criteria. Additionally, the 50th percentile peer group calculated measure, and benchmark calculated measure (if applicable) for the criteria are displayed.
Note: If separate Passive and/or Target Date Fund criteria are selected, the report will split into sub-sections displaying the separate scoring fund scores on separate pages.

Fund Fact Sheets
Download Sample Fund Fact Sheets Report Section
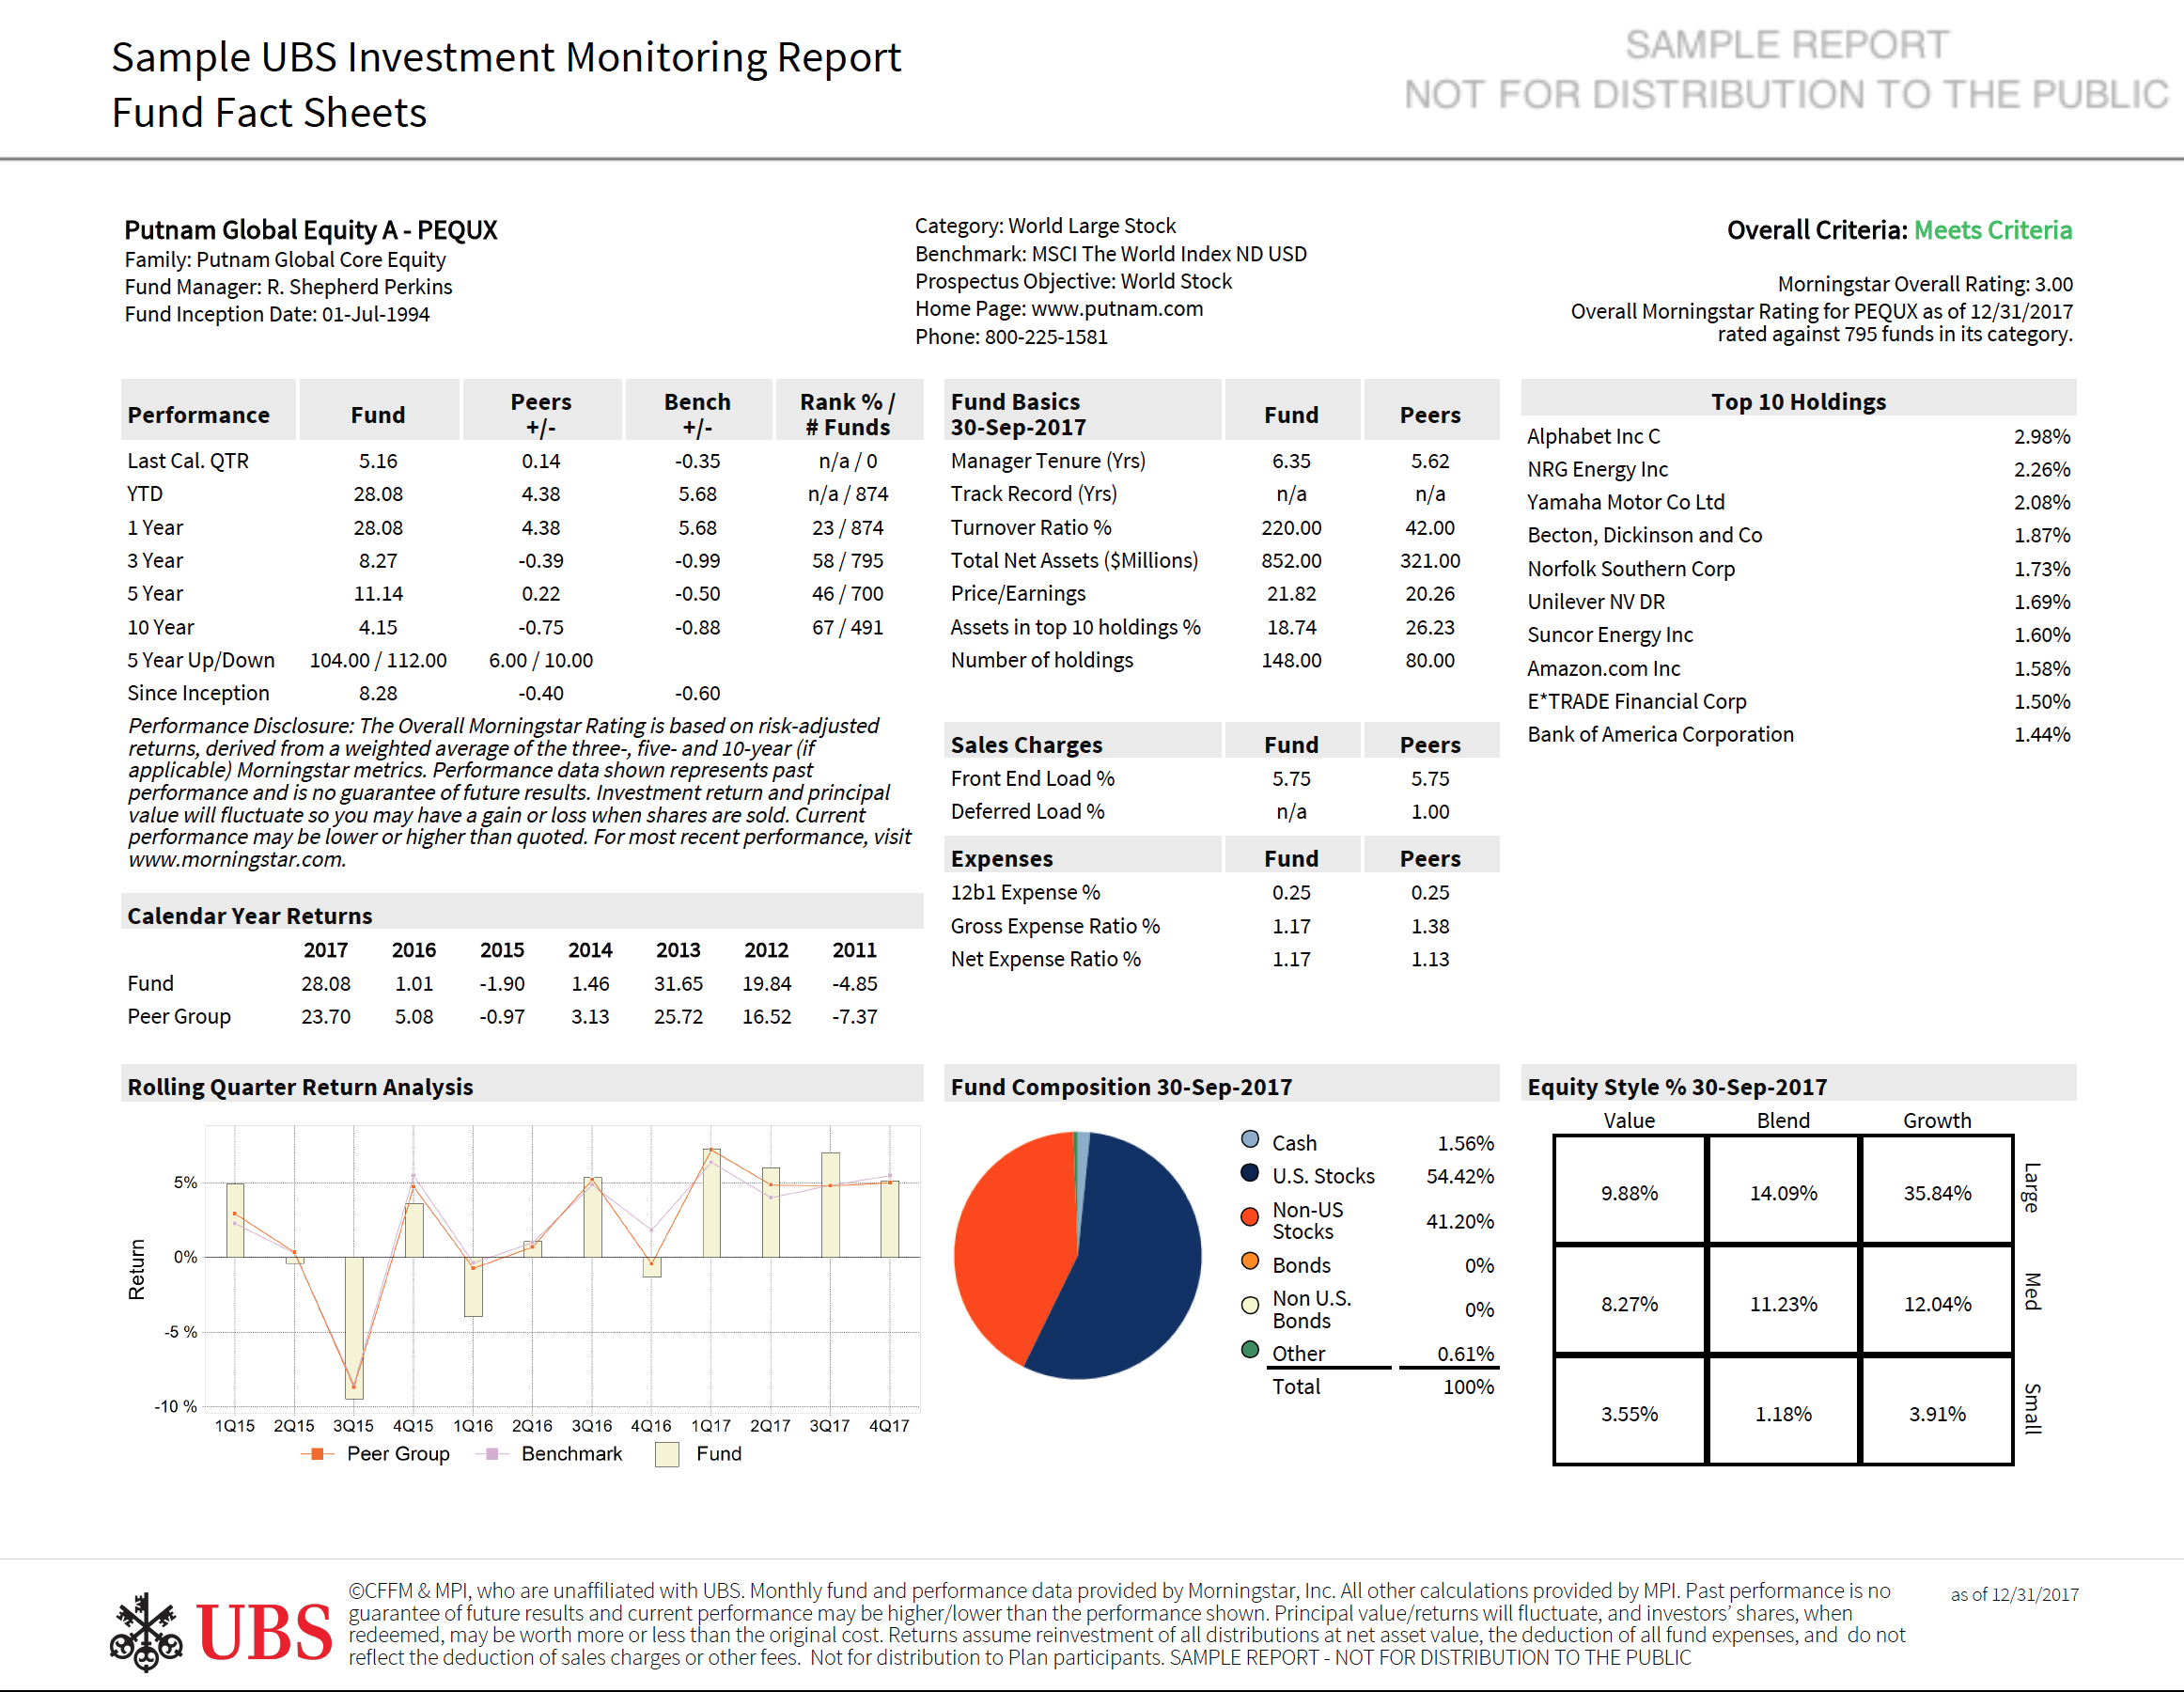
The Fund Fact Sheets report section contains a detailed fund fact report for each fund in the fund lineup. The Fund Fact Report includes various additional data-points and measures for each fund to include Top 10 Holdings, Rolling Quarter Return Analysis, Calendar Year Quartile Rankings, and Fund Risk / Return.
Important Information About This Report
Download Sample Important Information About This Report Section
The Important Information About This Report report section contains disclosures and additional detail on various items including report sections, fund scoring features, and fund types.
Market Overview
Download Sample Market Overview Report Section
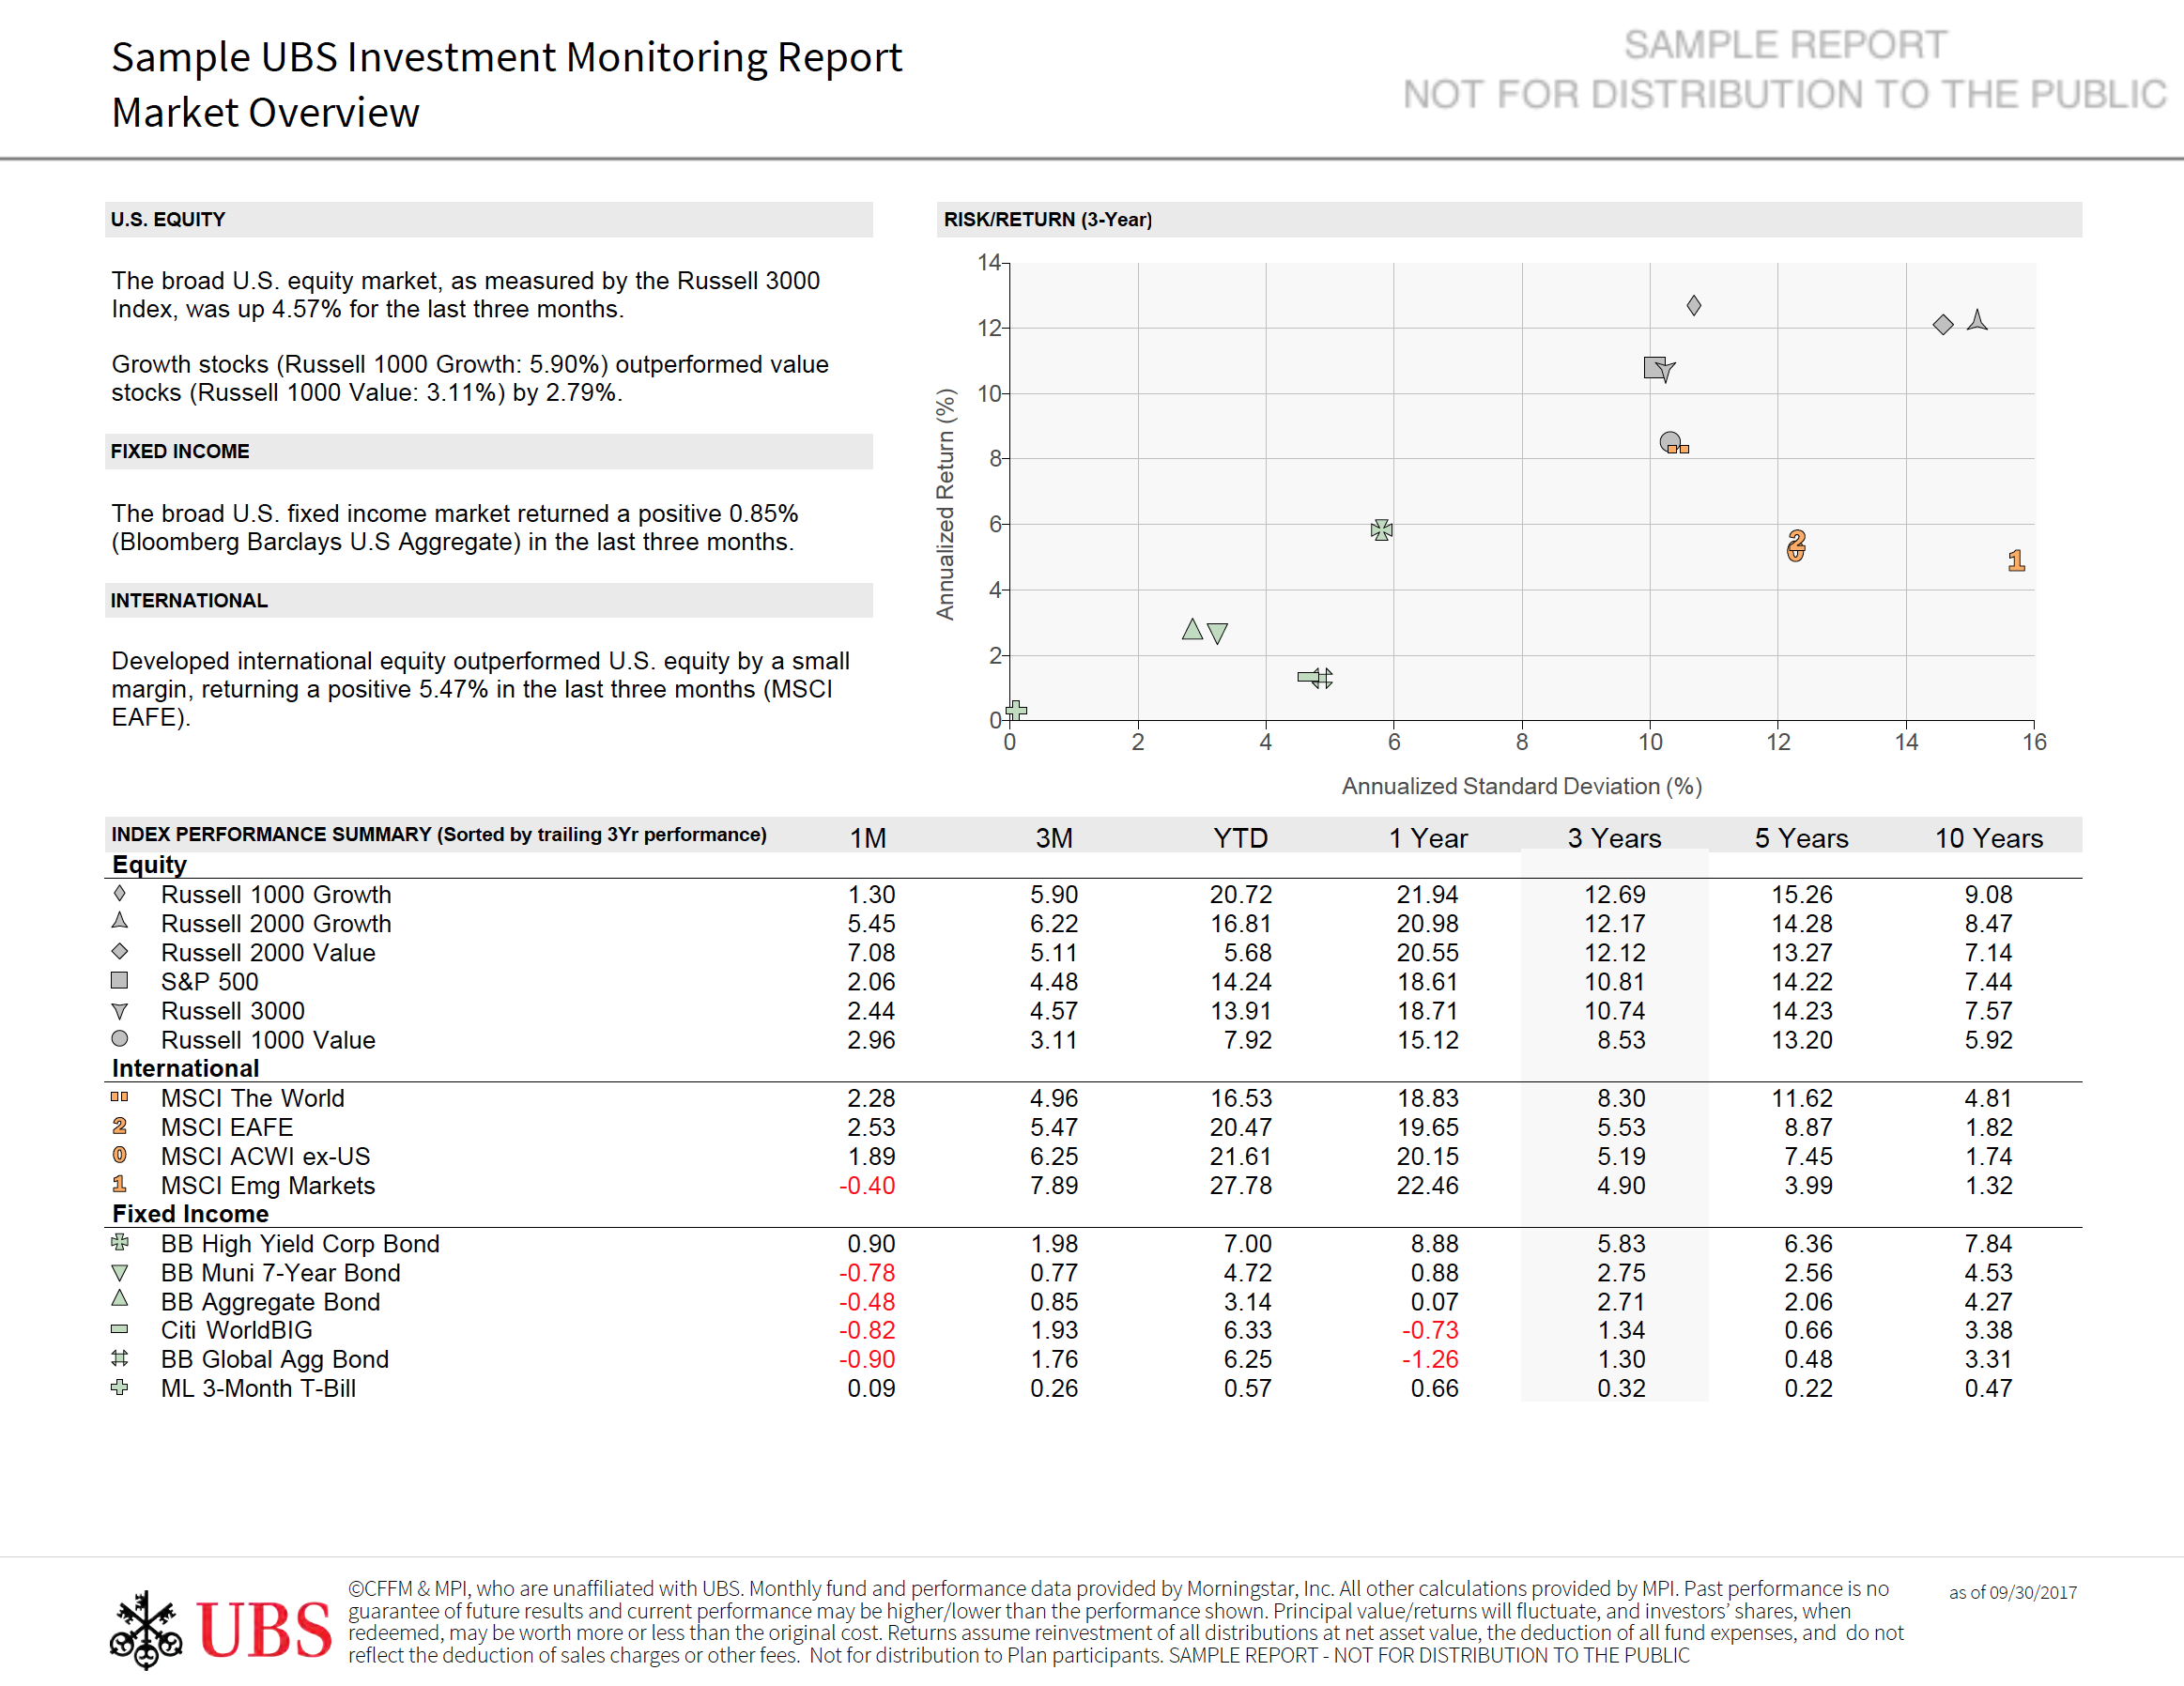
The Market Overview report section is a thorough review of the market and encompasses everything in the Market Snapshot (see below) and more. This includes separate pages to further examine Fixed Income, US Equities, and Non-US Equities.
Market Snapshot
Download Sample Market Snapshot Report Section
The Market Snapshot report section provides a top-level overview of the market by examining the returns on many US Equity, Non-US Equity, and Fixed Income indices.

Performance Summary
Download Sample Performance Summary Report Section
The Performance Summary report section provides fund performance details, fund by fund. The Performance Summary report section will provide fund returns data and peer group rankings for Last Quarter, Year to Date, 1 Year, 3 Year, 5 Year, 10 Year, and Since Inception time frames. Each fund's current asset balance, fund status, and fund score is also displayed. Additionally asset category peer group and benchmark return data is provided, along with the number of funds within the peer group.
Note: If separate Passive and/or Target Date Fund criteria are selected, the report will split into sub-sections displaying the separate scoring fund types on separate pages.

Portfolio Style
Download Sample Portfolio Style Report Section
The Portfolio Style report section provides a graphic view of the plan portfolio’s coverage across the universe of equity and fixed income investment styles as well as specialty styles. In addition, each fund's current asset balance, fund status, and fund score is also displayed.

UBS ERISA Extra
Download Sample UBS ERISA Extra Report Section
The UBS ERISA Extra report section is a quarterly update that provides helpful tips and insights on various retirement plan topics.

Calendar Year Performance
Download Sample Calendar Year Performance Report Section
The Calendar Year Performance report section looks at the last ten years of returns for each fund, the category benchmark, and the category peer group median. This is all grouped into a condensed format to compare funds more easily.

Fund Monitoring
Download Sample Fund Monitoring Report Section
The Fund Monitoring report section shows the fund's return rank over different time periods as well as whether it outperformed or underperformed its assigned benchmark over those periods. This section also displays the Expense Ratio rank of the fund within its peer group.

Investments Within This Report
Download Sample Investments Within This Report Report Section
The Investments Within This Report report section provides a quick summary that lists all of the funds includes in the Plan's fund lineup with their associated tickers, inception dates, asset categories, and category benchmarks.

Returns Correlation Matrix (3/5/10 YR)
Download Sample Returns Correlation Matrix Report Section
The Returns Correlation Matrix report section displays a returns correlation matrix of all funds included in the Plan's fund lineup. It is color-coded to help you easily identify areas of high and low correlation.

Risk Analysis (3/5/10 YR)
Download Sample Risk Analysis Report Section
The Risk Analysis report section displays return and standard deviation related analytics. These include both total and excess returns, standard deviations, information ratio and sharpe ratio. Additionally, the category benchmark and peer group median values are displayed.

Risk Analysis - Current vs Proposed (3/5/10 YR)
Download Sample Risk Analysis - Current vs Proposed Report Section
The Risk Analysis - Current vs Proposed report section compares the current funds in the Plan's fund lineup vs any proposed funds side by side. The funds will be compared based on returns, standard deviation, and sharpe ratio. Data for the category benchmark, peer group median, and number of funds in the category are also displayed.

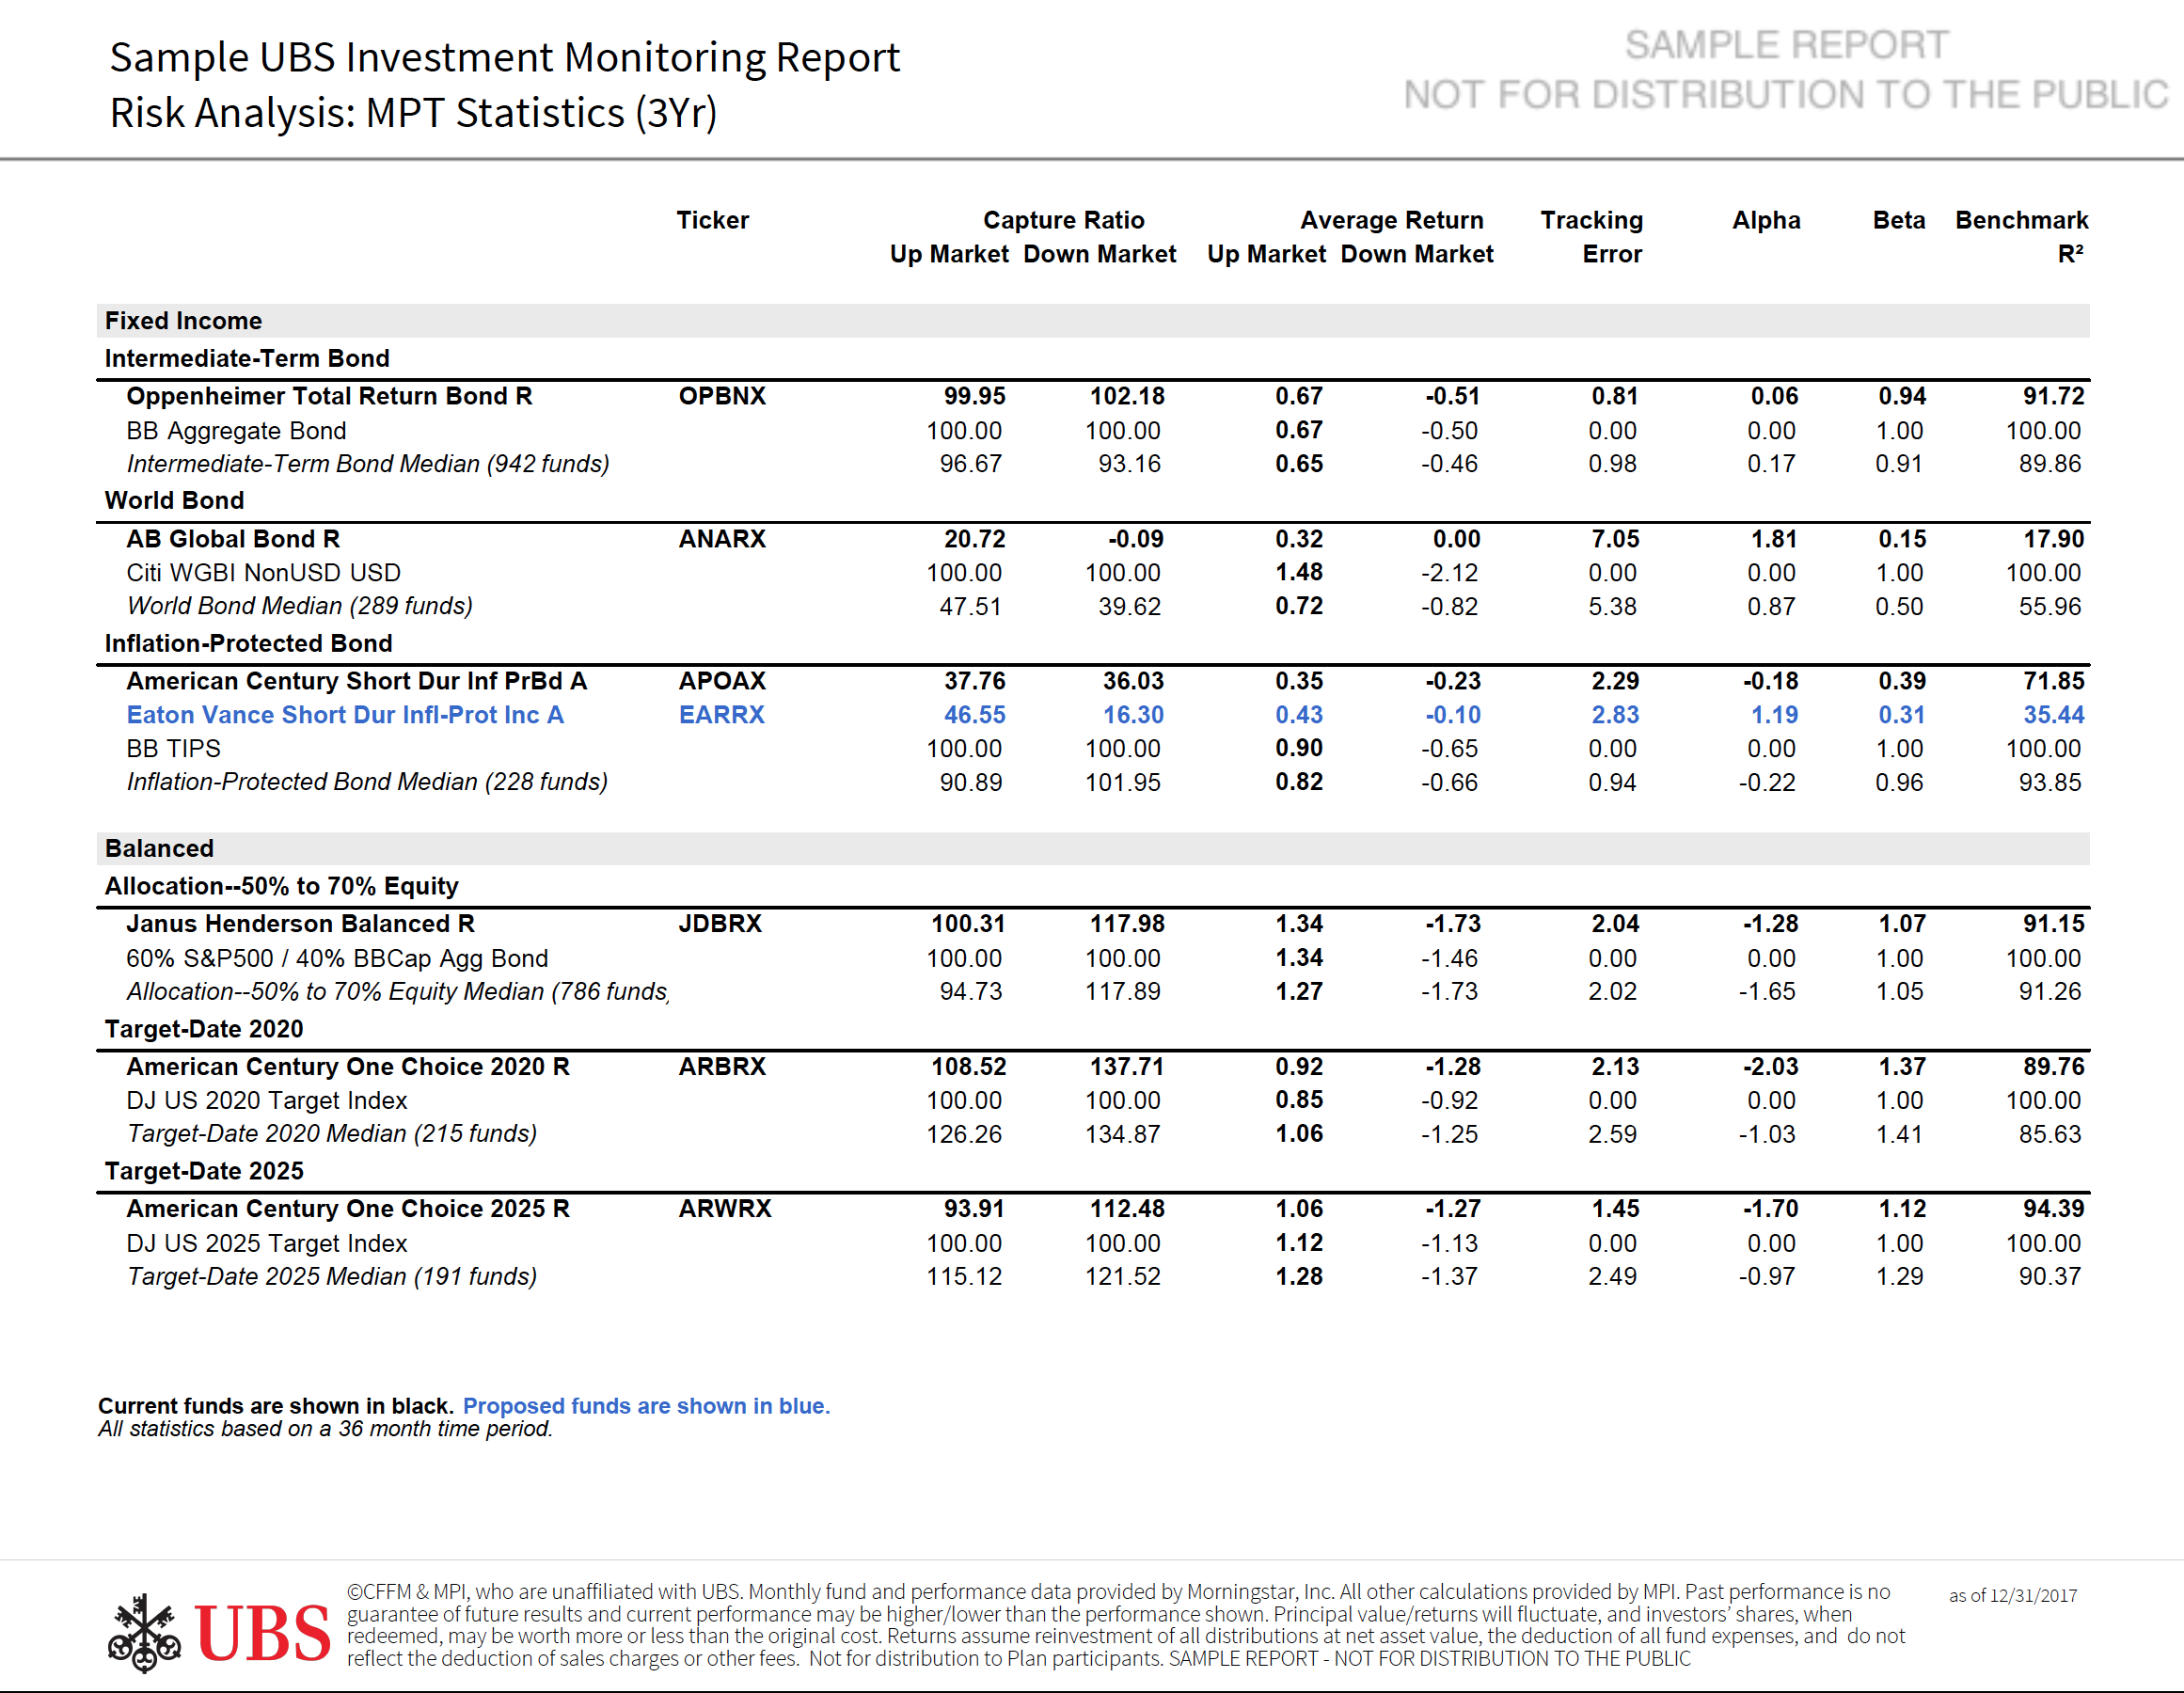
Risk Analysis: MPT Statistics (3/5/10 YR)
Download Sample Risk Analysis: MPT Statistics Report Section
The Risk Analysis report section displays risk and return analytics related to the fund's category benchmark. This section groups funds by asset category and displays up/down capture ratios, average returns, tracking error, alpha, beta, and R² all with respect to the category benchmark. Benchmark and peer group median values are displayed as well.
Style Analysis (3/5/10 YR)
Download Sample Style Analysis Report Section
The Style Analysis report section displays the returns-based exposures of the funds and category benchmarks to a set of investible indices. The purpose of this section is to reveal what the fund's investment style is by how the investment behaves, rather than by what the manager says the investment holds. The Style Drift value shows how much movement these values display over time, with a larger value meaning larger changes in exposures.

Style Analysis - Current vs Proposed (3/5/10 YR)
Download Sample Style Analysis - Current vs Proposed Report Section
The Style Analysis - Current vs Proposed report section compares the current funds in the Plan's fund lineup vs any proposed funds side by side. The funds will be compared based on the returns-based exposures of each fund over time, along with the R² of how well the data fits the model. A Style Drift value is also shown to quantify the movement in the charts above. A larger value means more movement, where as a smaller value is a more static investment.

Target Date Fund Analysis
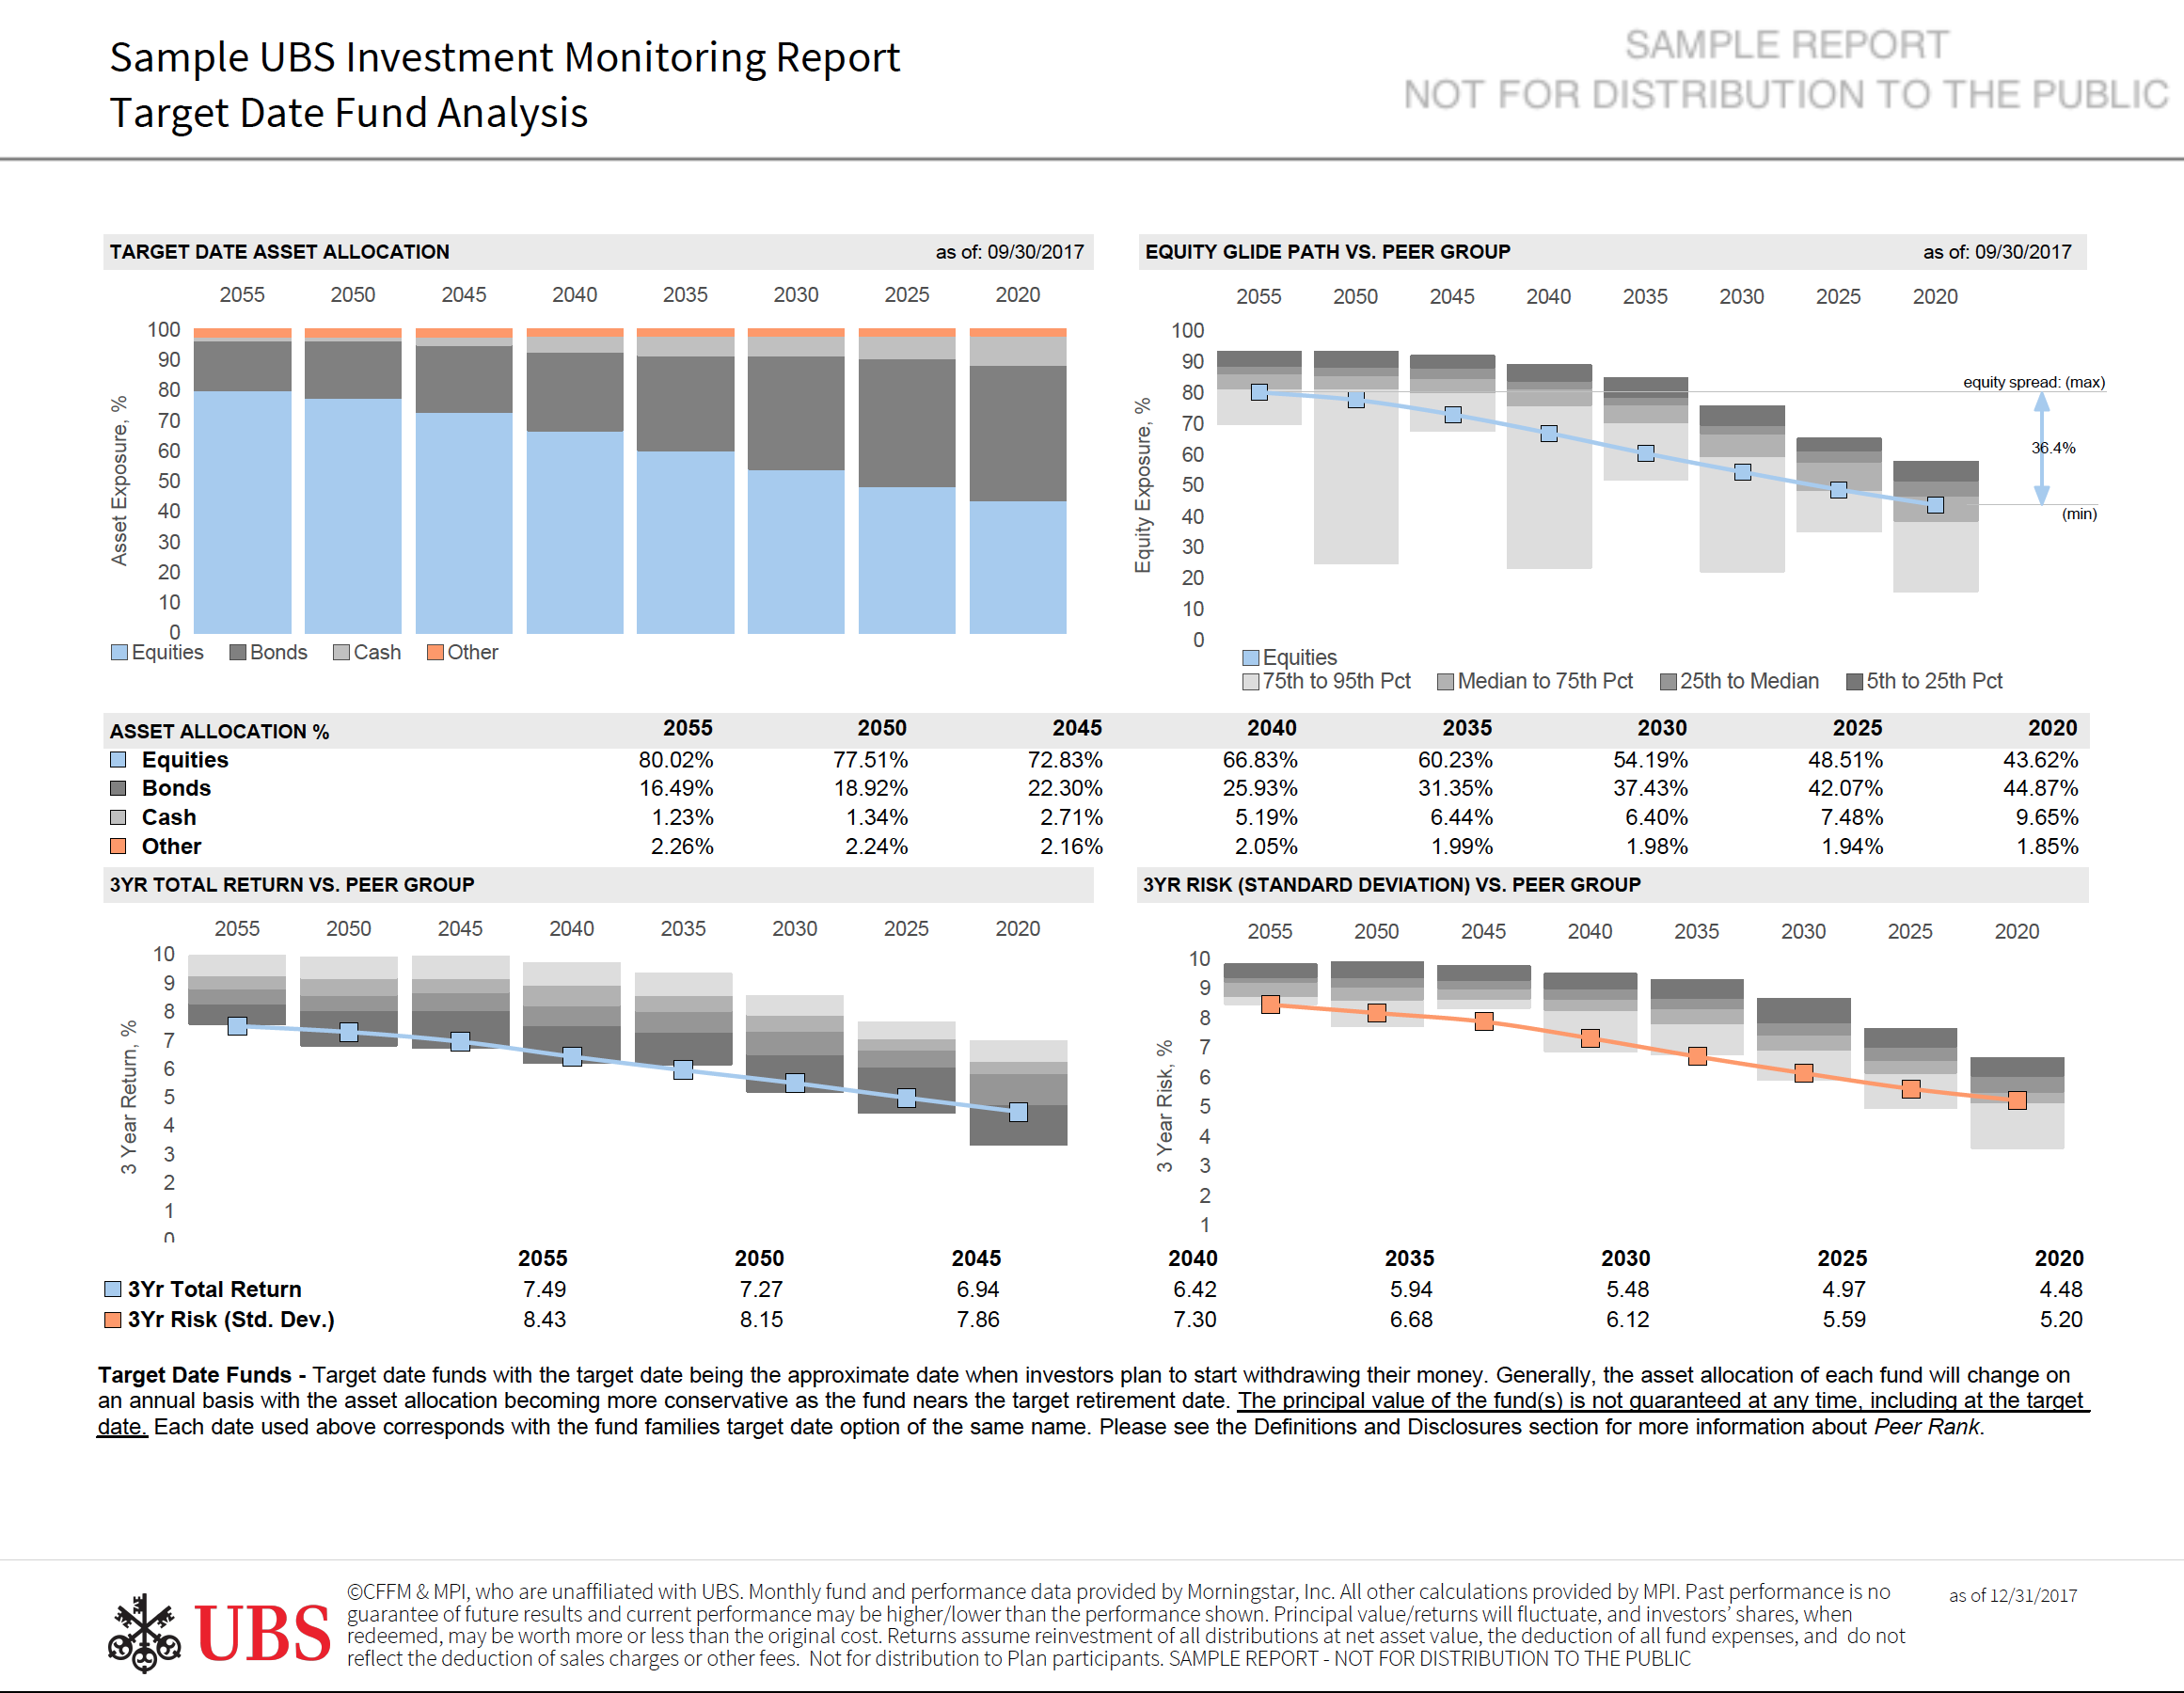
Download Sample Target Date Fund Analysis Report Section
The Target Date Fund Analysis report section shows the asset allocation information for a target date fund series, as well as the equity glide path among the series of funds. The return and standard deviation values are also displayed, with the peer group distribution as a backdrop to give you a sense of where the funds lie in relation to the universe.